Operation
step by stepMETEOR compares an air handling unit with and without heat recovery over one full weather year — 8760 hourly steps. You enter the unit, METEOR returns the annual energy demand, the saving, the payback time and the CO2 balance.
-
Choose the location
Block 01 on the calculation page. The location selects the weather file (EPW). It supplies outdoor temperature, humidity and air pressure for every hour of the year, so it determines the whole result.
Pick the station closest to the site. 76 locations are available.
-
Enter the heat recovery system
Block 02. Air volume, efficiency, pressure drop and purchase price.
By default supply and extract air are treated as equal. Press Unbalanced air flow to enter differing values — METEOR then corrects the efficiency by the mass flow ratio.
Enter the efficiency as the value for balanced air flow; the correction is applied automatically.
-
Set the air condition
Block 03. Extract air temperature is the room temperature, supply air temperature is the setpoint the unit has to reach.
Switch off heating or cooling cases if the unit only ever heats or only ever cools.
-
Define the operating time
Block 04. Only hours inside the selected window are calculated — hours, months and weekdays are combined.
Example: 08 → 17 o'clock, months 1 → 12, Monday to Friday gives a standard office schedule. Deselecting Saturday and Sunday removes about 2500 hours per year and lowers both demand and saving accordingly.
The counter below the day buttons shows how many days are active. With no day selected there is nothing left to calculate.
-
Enter energy prices and emission factors
Block 05. Prices per kWh for heating, cooling and electricity, plus the matching CO2 factors. Interest rate and inflation feed the present value calculation to VDI 3803 sheet 5.
Maintenance and operating costs are annual and are part of the life cycle cost.
-
Enter the fans
Block 06. System efficiency and auxiliary power for supply and extract fan. They determine the additional electricity needed to overcome the pressure drop of the heat exchanger — the cost side of heat recovery.
-
Start the calculation
The result page opens automatically and stays reachable under its own address, so it can be bookmarked or shared.
-
Read the result
Payback time, capital value of the savings and the annual recovery rate are the key figures. The monthly bars show demand versus saving, the h-x chart shows every operating hour before and after the heat exchanger.
A negative saving means the heat recovery does not pay off under the entered conditions — typically when the additional fan power outweighs the recovered energy.
DATA
In this chapter the input is described. It describes which settings the user has to make in the program to get a result. Go to the homepage and click on the button GO. Then the input prompt opens. Fill in E-Mail, choose in the drop-down menu the location. On the input prompt you will see three drop down menus called:
- Required Data: please fill in atleast this data
- Energy Data: energy cost may vary from country to country. However we insert for you some base values
- Time Data: runtime for the air handlin unit

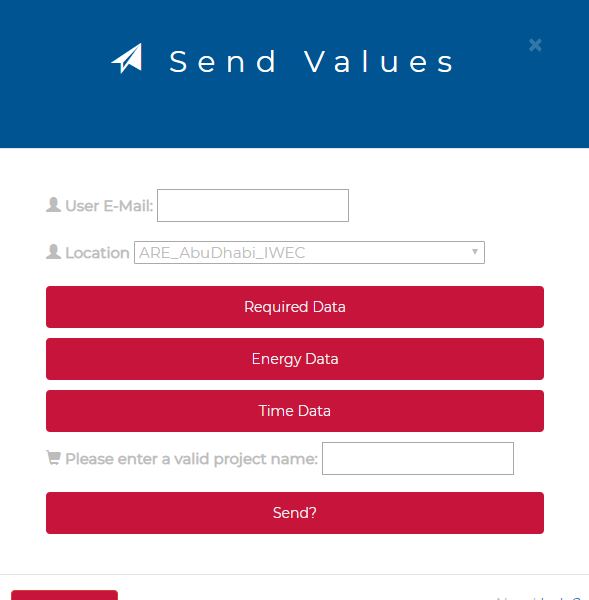
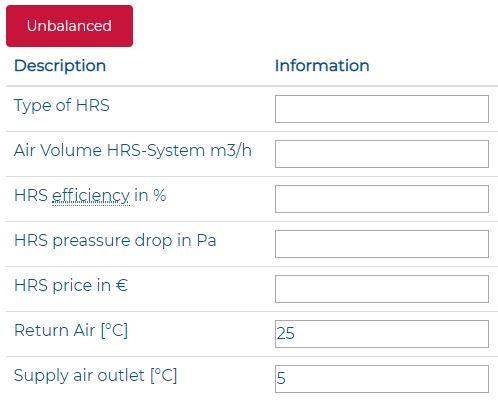
The last thing you have to do is to give the project a project name. Let us dive in a little deeper into the rquired data. Here we have the option to choose from balanced and unbalanced air flow. As balanced air flow is just special case of unbalanced we will in the following table describe the unbalanced option.
| Name | Description |
|---|---|
| Type of HRS | Insert here your type of heat recovery system. Please have a look at the descibed limitations of the software in order to get an idea which heat recovery systems can be calculated. |
| Air Volume supply HRS [m3/h] | This is the air coming from the outside. We assume that you dont heat up the air before going into the heat exchanger. |
| Air Volume return HRS [m3/h] | This is the air coming from the room. |
| HRS efficiency [%] | We do calclulate that the efficiency is decreasing when the air flow is not balanced. |
| HRS preassure drop supply [Pa] | This is the preassure drop or resisitance for the air volume which is coming from outside and going to the room |
| HRS preassure drop return [Pa] | This is the preassure drop or resistance for the air volume which is coming from the room going through the HRS in the direction of outside |
| HRS price [€] | This are the costs of the HRS system |
| Return Air [°C] | Temperature coming from the room |
| Supply air [°C] | Temperature of the air to the room |
We understood how we can insert the basic values in order to start the calculations. Let us dive deeper into the options. There are to more functions we can use in order to be more accurare in our calculations those two options are described in the follwing:
Energy Data:
as stated before energy cost can vary from country to country they vary of course also inside an country. We think we have insert some basic values which could fit to you. However it is up to you to check if those values make sense in your situation. In the following a table which helps you a little bit to understand the values which you can insert in this section.
| Name | Description |
|---|---|
| Heating Price [€/kWh] | Insert here the price you have to pay for heating up |
| Cooling Price [€/kWh] | Insert here the price you have to pay for cooling down |
| Rate of interes [%] | XXXXXXXXXX |
| Rate of price increase [%] | xxxx |
| HRS price install [€] | As you have to install the HRS inside your AHU, this will lead to additional costs. Such cost can be: working time, additional costs due to increasing AHU size and so on. If the HRS is big this value may have an significant amount. |
| Additional cost for maintenance [€] | Your HRS-System has to be cleaned or at least inspected once a year. Those are than additional costs which you would have to pay |
| Additional cost for opperation [%] | Okey, the additional electricity we already take into account, based on the preassure drop. However it can be that you have other opperational cost such us pumps or so. |
Time Data:
Probably your AHU is not running 24/7. So let us take this into accoount in our software.
| Name | Description |
|---|---|
| Start Time | This is the time you are turning on the AHU |
| Stop Time | Time you are turning off the AHU |
| Start Month | The month when you are turning on your AHU |
| End Month | The month you are turning off your AHU |
REPORT
Okey you have inserted the values and now you are looking at the report but maybe you aks your self: What do I see?
Will be updated